Grafana: Dynamic Retentions (InfluxDB): Unterschied zwischen den Versionen
Admin (Diskussion | Beiträge) |
Admin (Diskussion | Beiträge) |
||
| Zeile 2: | Zeile 2: | ||
Downsampling in InfluxDB means you create a new "database/bucket" and write the downsampled data into it. This leads to problems with dashboards. | Downsampling in InfluxDB means you create a new "database/bucket" and write the downsampled data into it. This leads to problems with dashboards. | ||
| − | = Problem explanation = | + | == Problem explanation == |
We assume: You have three different retention policies/configurations. | We assume: You have three different retention policies/configurations. | ||
*telegraf: Retention = 30 Days, Granularity = raw | *telegraf: Retention = 30 Days, Granularity = raw | ||
| Zeile 14: | Zeile 14: | ||
| + | == Solution == | ||
| + | To prevent the mentioned problem above, we are using Grafana's "Template Variables" to create a dynamic retention selection. | ||
| − | + | === Grafana template variables for dynamic retention policies on InfluxDB 2.x === | |
| − | == Grafana template variables for dynamic retention policies on InfluxDB 2.x == | + | |
''In InfluxDB 2.x retention policies are no longer seperate objects like in InfluxDB 1.x. In InfluxDB 2.x retention is an bucket configuration.'' | ''In InfluxDB 2.x retention policies are no longer seperate objects like in InfluxDB 1.x. In InfluxDB 2.x retention is an bucket configuration.'' | ||
| + | |||
| + | === Grafana template variables for dynamic retention policies on InfluxDB 1.x === | ||
| + | [[Datei:01-dynamic_retention_policies.png|800px]] | ||
| − | |||
| − | |||
Version vom 6. Januar 2021, 14:50 Uhr
If you plan to store metric data in an InfluxDB for a long time, you have to downsample the data (reduce the granularity to increase the scalability). More about downsampling: InfluxDB: Downsampling
Downsampling in InfluxDB means you create a new "database/bucket" and write the downsampled data into it. This leads to problems with dashboards.
Inhaltsverzeichnis
Problem explanation
We assume: You have three different retention policies/configurations.
- telegraf: Retention = 30 Days, Granularity = raw
- telegraf_90d: Retention = 90 Days, Granularity = 1h
- telegraf_365d: Retention = 365 Days, Granularity = 12h
If we create a dashboard, for example in Grafana, we have to specify the bucket (InfluxDB 2.x) or the retention-policy (InfluxDB 1.x) in our query.
For example we write our query to select the bucket "telegraf". This bucket have only data 30 days back because of the retention configuration.
This means if we select an timespan in Grafana > 30 days, the data are not complete, respectively data older then 30 days are missing.
This is because the data older then 30 days are not anymore stored in the bucket "telegraf" instead the data are stored downsampled in the bucket "telegraf_90d".
Solution
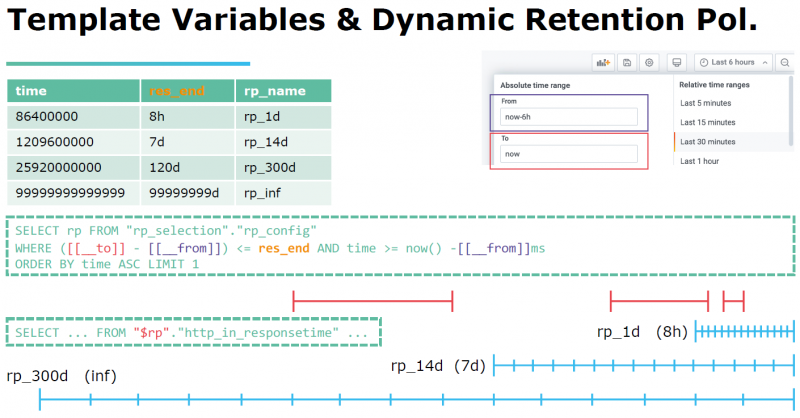
To prevent the mentioned problem above, we are using Grafana's "Template Variables" to create a dynamic retention selection.
Grafana template variables for dynamic retention policies on InfluxDB 2.x
In InfluxDB 2.x retention policies are no longer seperate objects like in InfluxDB 1.x. In InfluxDB 2.x retention is an bucket configuration.
