Hyper-V: Performance (Counters): Unterschied zwischen den Versionen
Admin (Diskussion | Beiträge) K |
Admin (Diskussion | Beiträge) |
||
| Zeile 49: | Zeile 49: | ||
*'''Additional informations''': | *'''Additional informations''': | ||
Veeam writes in the documentation about Veeam ONE 11 following that is very likely a typing error: <br> | Veeam writes in the documentation about Veeam ONE 11 following that is very likely a typing error: <br> | ||
| − | [[Datei:02-cpu wait time per dispatch-veeam.png| | + | [[Datei:02-cpu wait time per dispatch-veeam.png|1000px]] |
Version vom 5. Januar 2022, 17:42 Uhr
Inhaltsverzeichnis
[Verbergen]- 1 Recommended Performance Counter
- 1.1 Hyper-V Hypervisor Logical Processor
- 1.2 Hyper-V Hypervisor Virtual Processor
- 1.3 Hyper-V Hypervisor Root Virtual Processor
- 1.4 CPU Wait Time per Dispatch
- 1.5 Hyper-V Hypervisor Logical Processor - Physical CPU Context Switching
- 1.6 Memory
- 1.7 Memory (NUMA)
- 1.8 Hyper-V Dynamic Memory
- 1.9 LogicalDisk
- 1.10 PhysicalDisk
- 1.11 Cluster Shared Volumes
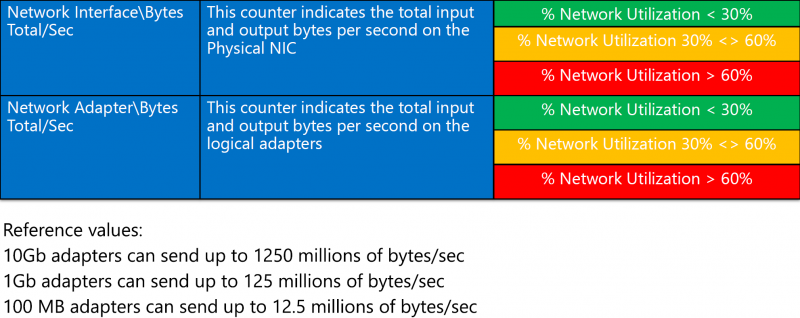
- 1.12 Network Interface
- 1.13 Monitored Notifications
- 1.14 Hyper-V Number of Partitions (Root + VMs)
- 1.15 Hyper-V Virtual switch\Bytes received/sec
- 1.16 Hyper-V Virtual switch\Bytes sent/sec
- 1.17 Hyper-V Virtual Storage Device\IO Quota Replenishment Rate
- 1.18 Network Output Queue Length
- 1.19 CSV IO Queue Length
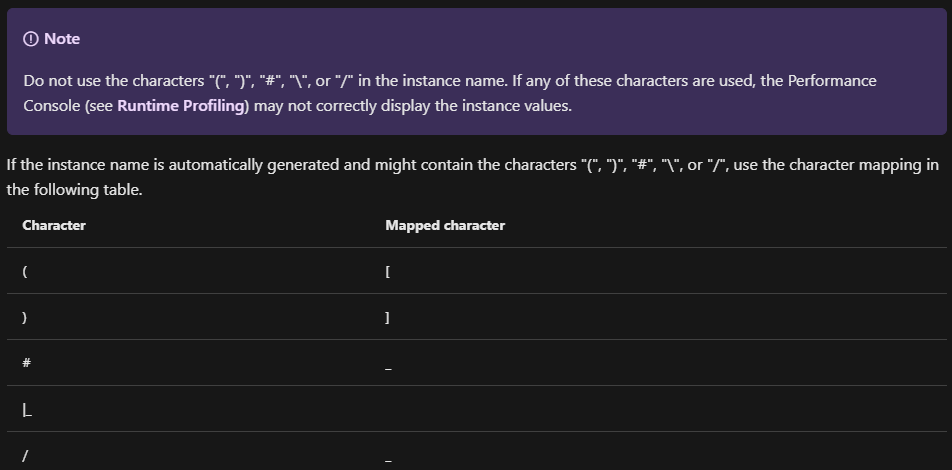
- 2 Character Mapping
Recommended Performance Counter
Hyper-V Hypervisor Logical Processor
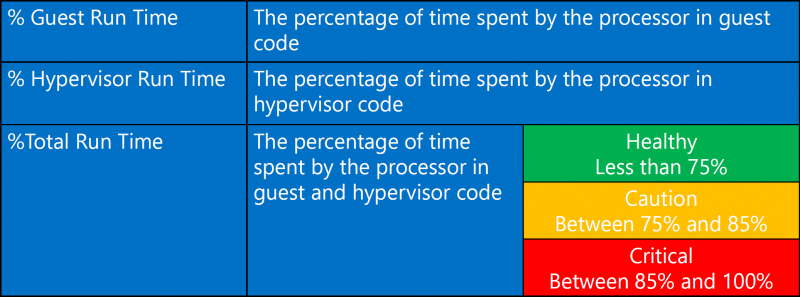
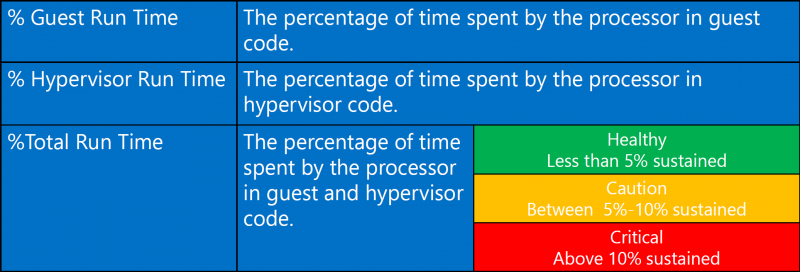
There is one instance of HVH Logical Processor counters available for each hardware logical processor that is present on the machine. The instances are identified as VP 0, VP 1, …, VP n-1, where n is the number of Logical Processors available at the hardware level. The counter set is similar to the Processor Information set available at the OS level (which also contains an instance for each Logical Processor). The main metrics of interest are % Total Run Time and % Guest Run Time. In addition, the % Hypervisor Run Time counter records the amount of CPU time, per Logical processor, consumed by the hypervisor.
Hyper-V Hypervisor Virtual Processor
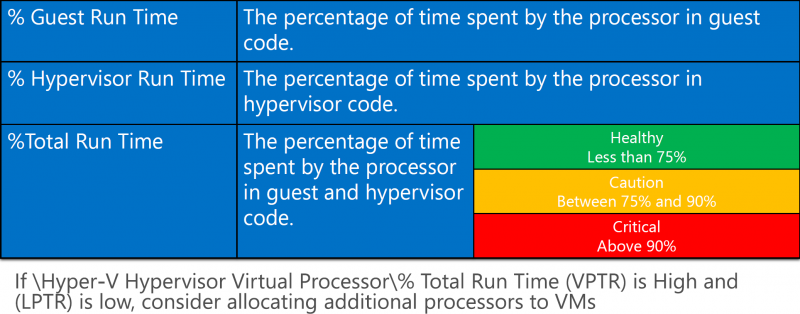
There is one instance of the HVH Virtual Processor counter set for each child partition Virtual Processor that is configured. The guest machine Virtual Processor is the abstraction used in Hyper-V dispatching. The Virtual Processor instances are identified using the format guestname: Hv VP 0, guestname: Hv VP 1, etc., up to the number of Virtual Processors defined for each partition. The % Total Run Time and the % Guest Run Time counters are the most important measurements available at the guest machine Virtual Processor level.
Hyper-V Hypervisor Root Virtual Processor
The HVH Root Virtual Processor counter set is identical to the metrics reported at the guest machine Virtual Processor level. Hyper-V automatically configures a Virtual Processor instance for each Logical Processor for use by the Root partition. The instances of these counters are identified as Root VP 0, Root VP 1, etc., up to VP n-1.
CPU Wait Time per Dispatch
CPU wait time per dispatch (Hyper-V). Show the average queue time for the virtual machine waiting for CPU to become available, which comparable to the OS Scheduler’s Ready Queue. Unfortunately. Not much has been written about this extremely useful counter, except just acknowledging its existence.
If you see high CPU usage on the VMs but the host processors are not loaded, you definitely need to check the CPU wait time per dispatch metric and alarm. You may have allocated too many virtual CPUs to your VMs, making it a mess for the hypervisor. The rule of thumb is to set no more than eight virtual CPUs per each logical CPU.
This Metric is important per VM.
VMware Calculation
VMware by default takes a 20 second capture interval & provides a summation of time spent in Ready state. So you might find a value of 1500ms (summed) for a 20 second capture period. To get to a percentage you would simply take the 1500ms value & divide it by the amount of milliseconds in the 20 second capture period (20,000); then multiply by 100 to get a percentage of 7.5%. ((1500ms/20000ms)*100)
Calculate "CPU Wait Time per Dispatch" in %:

- What: The average time (in nanoseconds) spent waiting for a virtual processor to be dispatched onto a logical processor.
- Counter:
- Hyper-V Hypervisor Root Virtual Processor\CPU Wait Time per Dispatch
- Hyper-V Hypervisor Virtual Processor\CPU Wait Time per Dispatch
- Hyper-V Threshold:
- <25'000'000 Nanoseconds (25ms) per VM (vCores summed) & per second -> Generally No Problem!
- 25'000'000 - 50'000'000 Nanoseconds (25-50ms) per VM (vCores summed) & per second -> Minimal contention that should be monitored during peak times
- 50'000'000 - 100'000'000 Nanoseconds (50-100ms) per VM (vCores summed) & per second -> Significant Contention that should be investigated & addressed
- >100'000'000 Nanoseconds (>100ms) per VM (vCores summed) & per second -> Serious Contention to be investigated & addressed ASAP!
- VMware Threshold:
- <2.5% CPU Ready -> Generally No Problem!
- 2.5% - 5% CPU Ready -> Minimal contention that should be monitored during peak times
- 5% - 10% CPU Ready -> Significant Contention that should be investigated & addressed
- >10% CPU Ready -> Serious Contention to be investigated & addressed ASAP!
- What to do if threshold is exceeded:
- Check the virtual core to physical core ratio (Overcommitment of the CPUs).
- Check the CPU load of all VMs on the same hypervisor.
- Keep in mind that setting CPU Reservations does not solve CPU Ready.
- Additional informations:
Veeam writes in the documentation about Veeam ONE 11 following that is very likely a typing error:

Hyper-V Hypervisor Logical Processor - Physical CPU Context Switching
- What: This measures the rate (number of times per second) each logical CPU changes what virtual processor it is running.
- Counter: Hyper-V Hypervisor Logical Processor(*)\Context Switches/sec
- Threshold: (any instance (Core) except for "_Total") > 20000, (sustained for > 5min).
- Why: We use this as a general health & performance indicator for the host & virtual machines. This counter must be used in context with all other activity based counters (CPU, Disk & Network, latency & throughput).
- What to do if threshold is exceeded:
- Check VM config (particularly remove / disable any active & busy emulated devices)
- Check that the VM is using the correct version of the integration components.
- Check host operating system utilization Root VP CPU usage (host OS utilization) - see the "Hyper-V Hypervisor Root Virtual Processor" counter section for the specifics.
- Check drivers - particularly network and storage drivers, but other too.
- Check for significant inconsistency across your hosts - it can indicate significant configuration or load differences.
Memory
Memory (NUMA)
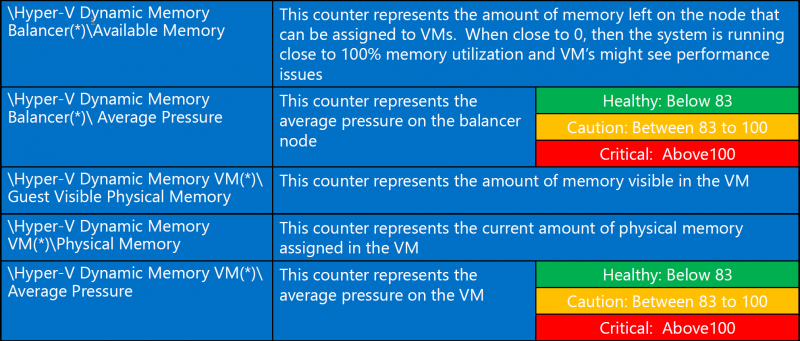
Hyper-V Dynamic Memory
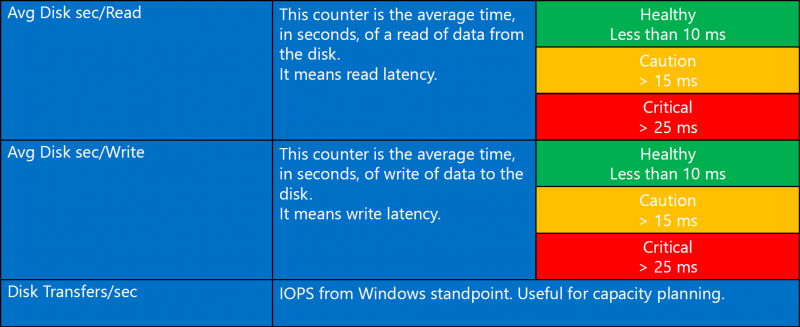
LogicalDisk
PhysicalDisk
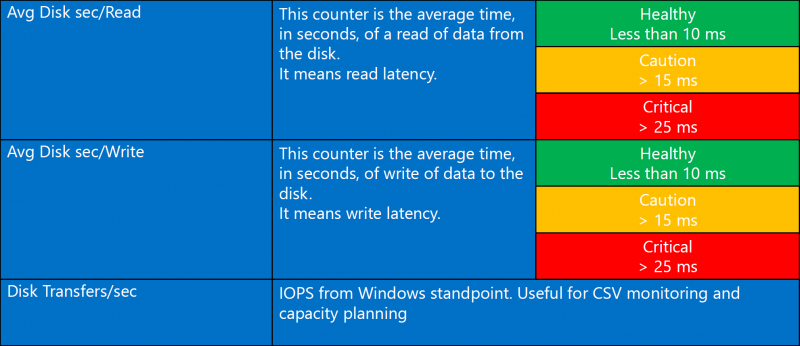
IO Write/Read Latency: Tells you how many seconds read/write operations take on average. If you see a value 0.003 that means IO takes 3 milliseconds. When all IO are sent using Direct IO then this value should be very close to PhysicalDisk\Avg.Disk sec/Read and PhysicalDisk\Avg.Disk sec/Write accordingly. If IO are sent using Block Level Redirected IO then counters value should be close to Smb Client Share\Avg.sec/Write and Smb Client Share\Avg.sec/Read.


(> 1 MB/s) indicates Shared VHDX files or that CSV is in redirected mode.
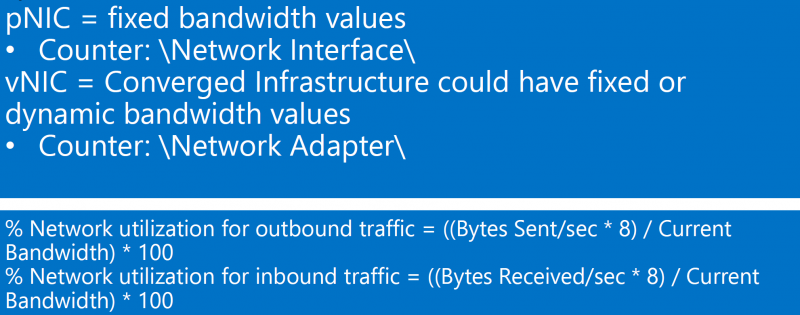
Network Interface
Monitored Notifications
Monitored notifications are part of an interrupt coalescing technique Hyper-V uses to reduce virtualization overhead. For example when a guest has data to transmit over the network it could send an interrupt for each packet to the root VP that will actually do the I/O or it can send one interrupt to let the root know data is starting to flow. This counter is an indication of the number of “flows” of interrupts being set to the root and guests.
Counter: Hyper-V Hypervisor\Monitored Notifications
Hyper-V Number of Partitions (Root + VMs)
Each virtual machine on the system is run in a container called a partition. If you have no VM’s running this value will be set to 1 because the “host OS” called the “root” in Hyper-V is also running in a partition. So if you have 2 guest VM’s running this value will be 3. +1 for each guest and +1 for the root.
Counter: Hyper-V Hypervisor\Partitions
Hyper-V Virtual switch\Bytes received/sec
This counter indicates the total bytes received per second on all ports of your Virtual Switch.
Counter: Hyper-V Virtual switch\Bytes received/sec
Hyper-V Virtual switch\Bytes sent/sec
This counter indicates the total bytes sent per second on all ports of your Virtual Switch.
Note that this counter may show the double consumption compared with the \Network Interface\Bytes Total/sec because it counts the Input and Output traffic of each port. If a Virtual Machine that is connected to an External Switch is sending 1000 bytes/sec this will means that the Virtual Switch is seeing 1000 bytes/sec on the port where the VM is connected and also 1000 bytes on the port of the switch that is connected to the external world.
Counter: Hyper-V Virtual switch\Bytes sent/sec
Hyper-V Virtual Storage Device\IO Quota Replenishment Rate
This counter represents the IO quota replenishment rate for this virtual device. (The current normalized IOPS per VHD.)
This counter can used to calculate the percentage usage of the configured StorageQoS.
Calculation: (100 / Maximum IO Rate) * IO Quota Replenishment Rate
Counter: Hyper-V Virtual Storage Device\IO Quota Replenishment Rate
- With the green marked Perfmon counters you can calculate the percentage of StorageQoS based on Maximum IOPS.
- With the pink marked Perfmon counters you can calculate the percentage of StorageQoS based on Bandwidth Limit.
Network Output Queue Length
The output queue length measures the number of threads waiting on the network adapter. If there are more than 2 threads waiting on the network adapter, then the network may be a bottleneck. Common causes of this are poor network latency and/or high collision rates on the network.
- Counter: \Network Interface(*)\Output Queue Length
- Threshold:
- 0 = Healthy
- 1-2 = Monitor or Caution
- > 2 = Critical, performance will be adversely affected.
Note: Ensure that the network adapters for all computers (physical and virtual) in the solution are configured to use the same value for maximum transmission unit (MTU). For more information about configuring the MTU value see “Appendix A: TCP/IP Configuration Parameters” at http://go.microsoft.com/fwlink/?LinkId=113716.
If an output queue length of 2 or more is measured, consider adding one or more physical network adapters to the physical computer that hosts the virtual machines and bind the network adapters used by the guest operating systems to these physical network adapters.
CSV IO Queue Length
These two counters tell how many outstanding reads and writes we have on average per second. If we assume that all IOs are dispatched using Direct IO then value of this counter will be approximately equal to PhysicalDisk\Avg.Disk Write Queue Length and PhysicalDisk\Avg.Disk Read Queue Length accordingly. If IO is sent using Block Level Redirected IO then this counter will be reflecting SMB latency, which you can monitor using SMB Client Shares\Avg. Write Queue Length and SMB Client Shares\Avg. Read Queue Length.
- Counter: \Cluster CSV File System\IO Write Avg. Queue Length
Character Mapping
Weitere Informationen / Quellen:
- https://blogs.msdn.microsoft.com/tvoellm/tag/Hyper-V-Performance-Counters/
- https://blogs.technet.microsoft.com/neales/2016/10/24/hyper-v-performance-cpu/
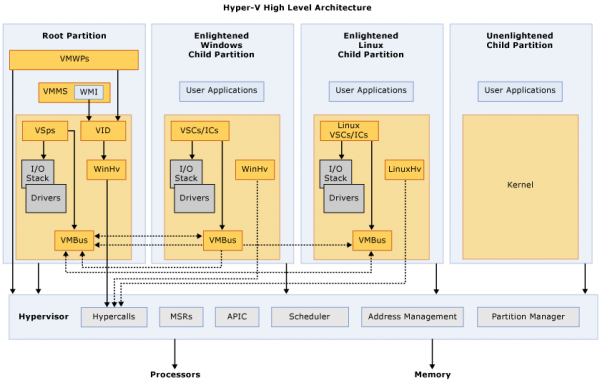
- http://computerperformancebydesign.com/hyper-v-architecture/
- https://blogs.msdn.microsoft.com/clustering/2014/06/05/cluster-shared-volume-performance-counters/
- http://www.enowsoftware.com/solutions-engine/bid/187606/CPU-Contention-and-Exchange-Virtual-Machines
- https://docs.microsoft.com/en-us/virtualization/hyper-v-on-windows/reference/hyper-v-architecture
- https://blogs.msdn.microsoft.com/tvoellm/2008/05/09/hyper-v-performance-counters-part-two-of-many-hyper-v-hypervisor-counter-set/
- https://blogs.technet.microsoft.com/cedward/2011/07/18/hyper-v-networking-optimizations-part-6-of-6-monitoring-hyper-v-network-consumption/
- https://msdn.microsoft.com/en-us/library/cc768535(v=bts.10).aspx
- https://blogs.msdn.microsoft.com/tvoellm/2008/03/20/hyper-v-clocks-lie-which-performance-counters-can-you-trust/
- https://blogs.technet.microsoft.com/chrisavis/2013/03/25/performance-management-monitoring-cpu-resources/
- https://docs.microsoft.com/en-us/dotnet/api/system.diagnostics.performancecounter.instancename?view=windowsdesktop-5.0&viewFallbackFrom=net-5.0
