Grafana: Alias by (Display name): Unterschied zwischen den Versionen
Admin (Diskussion | Beiträge) |
Admin (Diskussion | Beiträge) |
||
| (6 dazwischenliegende Versionen des gleichen Benutzers werden nicht angezeigt) | |||
| Zeile 1: | Zeile 1: | ||
| − | [[Datei:01-grafana alias-by.png|right]] | + | [[Datei:01-grafana alias-by.png|right|frame|Grafana Example with InfluxQL]] |
If you use a '''InfluxDB datasource with Query Language = InfluxQL''', in a Grafana panel there was an option '''ALIAS BY'''. <br> | If you use a '''InfluxDB datasource with Query Language = InfluxQL''', in a Grafana panel there was an option '''ALIAS BY'''. <br> | ||
This option is missing when you use a InfluxDB datasource with Query Language = Flux! <br> | This option is missing when you use a InfluxDB datasource with Query Language = Flux! <br> | ||
| − | In this article I show you how you can change the naming like with ''ALIAS BY'' | + | In this article I show you how you can change the naming like with ''ALIAS BY''. |
| − | + | In the following examples we want following naming schema (like the image to the right): '''<Description> - <Hostname>: <VMName>''' <br> | |
| − | In | + | |
*'''Description''' = Hardcoded description of the measurement "CPU Load Total" | *'''Description''' = Hardcoded description of the measurement "CPU Load Total" | ||
*'''Hostname''' = InfluxDB Tag "host" | *'''Hostname''' = InfluxDB Tag "host" | ||
*'''VMName''' = InfluxDB Tag "VMName" | *'''VMName''' = InfluxDB Tag "VMName" | ||
| + | == Change naming with the "Standard options" == | ||
| + | With the new panels from Grafana, there is new [https://grafana.com/docs/grafana/latest/panels/standard-options/ standard option] called '''Display name'''. Now this option can use variables. <br> | ||
| + | To reach the example from the image you can use following variables in the field '''Display name''': <br> | ||
| + | '''CPU Load Total - ${__field.labels.host}: ${__field.labels.VMName}''' | ||
| + | |||
| + | [[Datei:02-grafana display-name.png]] | ||
| + | |||
| + | |||
| + | |||
| + | == NOT RECOMMENDED - Change naming like ''ALIAS BY'' with map() & group() == | ||
| + | <span style="color:red">'''This example is not recommended because of performance reasons! (Tested with > 170'000 rows: 1.4s vs. 17.2s)'''</span> <br> | ||
<pre> | <pre> | ||
..<YOUR_FLUX_QUERY>.. | ..<YOUR_FLUX_QUERY>.. | ||
|> map(fn: (r) => ({ r with | |> map(fn: (r) => ({ r with | ||
| − | display_name: "CPU Load Total - " + r.host + ":" + r.VMName | + | display_name: "CPU Load Total - " + r.host + ": " + r.VMName |
})) | })) | ||
|> group(columns: ["display_name"]) | |> group(columns: ["display_name"]) | ||
| Zeile 21: | Zeile 31: | ||
| + | |||
| + | === Similar Query from image but in Flux === | ||
| + | <pre> | ||
| + | from(bucket: "telegraf") | ||
| + | |> range(start: v.timeRangeStart, stop:v.timeRangeStop) | ||
| + | |> filter(fn: (r) => | ||
| + | r._measurement == "hyperv_virtual_processor" and | ||
| + | r._field == "Percent_Total_Run_Time_mean" and | ||
| + | r.VMName == "TestRHE01" | ||
| + | ) | ||
| + | |> map(fn: (r) => ({ r with | ||
| + | display_name: "CPU Load Total - " + r.host + ": " + r.VMName | ||
| + | })) | ||
| + | |> group(columns: ["display_name"]) | ||
| + | |> aggregateWindow(every: v.windowPeriod, fn: mean, createEmpty: false) | ||
| + | </pre> | ||
Aktuelle Version vom 9. September 2021, 10:17 Uhr
If you use a InfluxDB datasource with Query Language = InfluxQL, in a Grafana panel there was an option ALIAS BY.
This option is missing when you use a InfluxDB datasource with Query Language = Flux!
In this article I show you how you can change the naming like with ALIAS BY.
In the following examples we want following naming schema (like the image to the right): <Description> - <Hostname>: <VMName>
- Description = Hardcoded description of the measurement "CPU Load Total"
- Hostname = InfluxDB Tag "host"
- VMName = InfluxDB Tag "VMName"
Change naming with the "Standard options"
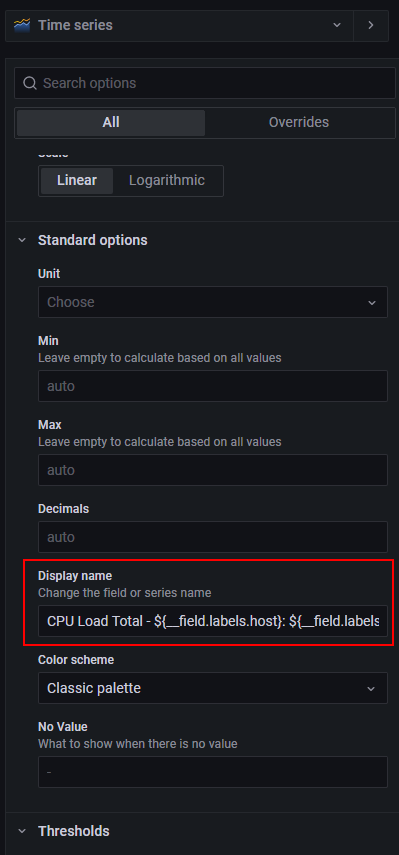
With the new panels from Grafana, there is new standard option called Display name. Now this option can use variables.
To reach the example from the image you can use following variables in the field Display name:
CPU Load Total - ${__field.labels.host}: ${__field.labels.VMName}
NOT RECOMMENDED - Change naming like ALIAS BY with map() & group()
This example is not recommended because of performance reasons! (Tested with > 170'000 rows: 1.4s vs. 17.2s)
..<YOUR_FLUX_QUERY>..
  |> map(fn: (r) => ({ r with
    display_name: "CPU Load Total - " + r.host + ": " + r.VMName
  }))
  |> group(columns: ["display_name"])
  |> aggregateWindow(every: v.windowPeriod, fn: mean, createEmpty: false)
Similar Query from image but in Flux
from(bucket: "telegraf")
  |> range(start: v.timeRangeStart, stop:v.timeRangeStop)
  |> filter(fn: (r) =>
    r._measurement == "hyperv_virtual_processor" and
    r._field == "Percent_Total_Run_Time_mean" and
    r.VMName == "TestRHE01"
  )
  |> map(fn: (r) => ({ r with
    display_name: "CPU Load Total - " + r.host + ": " + r.VMName
  }))
  |> group(columns: ["display_name"])
  |> aggregateWindow(every: v.windowPeriod, fn: mean, createEmpty: false)

