Trace: Interrupts (DPC/ISR): Unterschied zwischen den Versionen
Aus Wiki-WebPerfect
Admin (Diskussion | Beiträge) |
Admin (Diskussion | Beiträge) |
||
| Zeile 18: | Zeile 18: | ||
*Sort the "Duration" in red <br> | *Sort the "Duration" in red <br> | ||
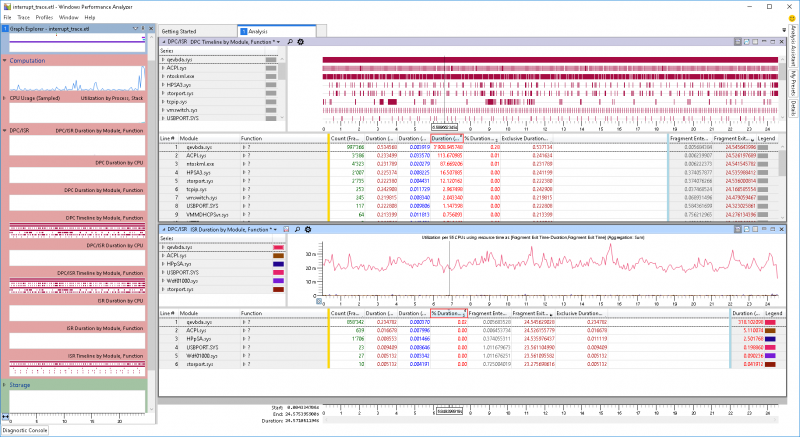
[[Datei:01-Windows Performance Analyzer.png|800px]] <br> | [[Datei:01-Windows Performance Analyzer.png|800px]] <br> | ||
| − | *The driver or process on the top generates the most interrupts and should be analyze further | + | *The driver or process on the top generates the most interrupts and should be analyze further (in our Example ''qevbda.sys'') |
Version vom 5. Februar 2019, 12:29 Uhr
Create Trace
Copy the directory "Windows Performance Toolkit" from the "Windows Assesment and Deployment Kit" installation directory to the Node to trace
Start Trace
xperf.exe -on base+interrupt+dpc
Stop Trace
xperf.exe -d interrupt_trace.etl
Analyze the trace
- Start the "Windows Performance Analyzer" and open the trace.
- Expand the following & double click on the graph to open it:
- Computation -> DPC/ISR -> DPC Timeline by Module, Function*
- Computation -> DPC/ISR -> ISR Duration by Module, Function*
- Sort the "Duration" in red
- The driver or process on the top generates the most interrupts and should be analyze further (in our Example qevbda.sys)
